 I am not currently using a full IDE for my bare metal C coding on OS-X. Thus is mainly due to my usage of an ARM targeting Clang/LLVM build) since I am compiling to LLVM bitcode, piping to opts and than handing the resulting object files directly to arm-none-eabi-ld. Makefile creation is the only way to get this build pipeline working as no IDE on any OS is natively supporting using LLVM as a cross-compiler for bare metal ARM (yet!).
Thus that leaves me in a term window a lot, not that I mind, but gdb (arm-none-eabi-gdb) based debugging can be a pain when you are used to working with a fully intergated IDE (I dream of Visual Studio style bare metal debugging ;-) . The ‘layout asm’ and ‘layout src’ text-based gui of gdb does help a lot but till you learn all the commands and setup custom command-sets, productivity tends to suffer…
There are several GUI-based interfaces that can ease the pain of using gdb. Eclipse has the CDT debug perspective that provides a complete wrapper to gdb MI commands and ddd (Data Display Debugger) provides a frontend to many session based cmd-line debuggers, including gdb. But I figured I would give Affinic Debugger a quick try to see how it work.
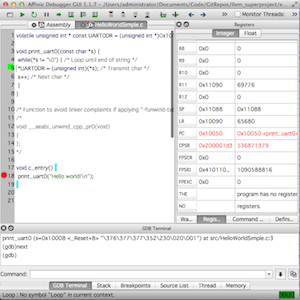
Using Affinic Debugger for GDB does not completely shield you from gdb and you also have access to the gdb terminal so as you learn gdb commands you can type them vs. clicking your way throught the GUI.
You can use it as a gdb learning tool, as all the gui actions that involve gdb cmds are echo’d in the intergated terminal.
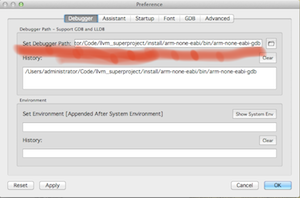
 After you download and install it, you will need to set which gdb you are using to debug your target. I am using a version of arm-none-eabi-gdb that I built, so start the app and open the Preferences and change the “Set Debugger Path” entry to the gdb that you are using. Affinic Debugger will need to restart after that change.
Lets debug something!
Using the HelloWorld example from last time, let re-compile it with Clang/LLVM using “-g -O0” so we get the debug symbols (-g) and remove any code optimizations (-O0) so the generated assembly is easy to follow and allow breakpoints to be set with the source code (depending upon optimization level, your breakpoints might be limited in the source view):
1 2 3 4 | |
Lets startup QEMU as we will use it as our remote gdb debugging target.
1
| |
Note: We are using the two following additional options in order to remotely debug our HelloWorldSimple.axf program:
* -s shorthand for -gdb tcp::1234
* -S freeze CPU at startup
Now start Affinic and connect to the QEMU gdb remote debugging server that is running. Enter the following into the “Command:” text field:
1 2 | |
Note: This is the same are if you were using gdb on the cmd-line. You can also use the Affinic menus to do this (Remote and File menus)
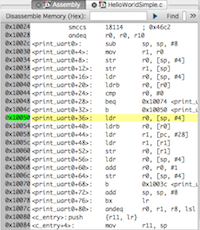
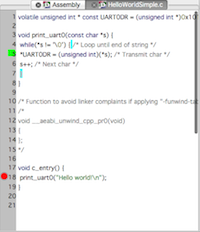
 You will see the assembly and source tabs filed. At this point you can set breakpoints, step through your source/assembly code, view register values, etc…

So far I like the Affinic Debugger interface, but I guess time will tell if I buy the full version after the 30 day trail, use the limited light/free version or setup ddd and/or Eclipse on my MacBookPro…
